


Intelligent Internet Systems
The key factor of the internet information technology on the quality of life for the elderly: application of grey system theory
Jui-Chen Huang*
Department of Health Business Administration, Hungkuang University, Taiwan, ROC
* Corresponding author. E-mail address:
Department of Health Business Administration, Hungkuang University, Taiwan, ROC
* Corresponding author. E-mail address:
Abstract: Increased access to the internet information technology has provided patients or users with a new source of information and the rapid growth of the internet information technology has triggered an information revolution. The purpose of this study was to discuss older adult users’ opinions on the use of internet information technology and its effect on their quality of life. This study surveyed the older adult users of Taiwan as subjects. The grey system theory was used to examine the model.
The results showed the overall living quality and social relationship have the greatest effects on the perceived effects of Internet on their quality of life, followed by the safety, acquisition of information, and accessibility of medical care services. This finding may serve as a reference to future studies and it also shows that the grey system theory is a feasible analysis method.
Keywords: grey system theory; internet information technology; Quality of life (QoL)
1. Introduction
Computers can present unique opportunities for older adults to minimize social and psychological problems. It can reduce loneliness and alienation [1-3]. Extensive qualitative and quantitative evidences also supported the Internet's potential that home Internet access enabled the informationally disadvantaged or low-income families to experience powerful emotional and psychological transformations in identity (self-perception), a new sense of confidence, and social standing or development of personal relationships on the Internet [4-7]. Besides, health information can increase individuals’ knowledge of their disease and its treatments, reduce distress and anxiety and help individuals make informed decisions regarding their treatment. It may potentially reduce health care costs for seniors. Increased access to the Internet has provided patients with a new source of information and the rapid growth of the Internet has triggered an information revolution [1-2, 8-12].
Nursing home residents demonstrated increased levels of independence through computer usage. In addition, it can increase life satisfaction. It can help older adults to improve their quality of life. Quality of life (QoL) is conceptualized as a generic, multidimensional construct that describes an individual's subjective perception of his or her physical and psychological health, as well as his or her social functioning, environment, and general life status [13-14].
In 1991, the WHO initiated a cross-cultural project to develop a quality-of-life (QoL) questionnaire (WHOQOL); soon after this, the clinically applicable short form was developed and named WHOQOLBREF, followed by a Taiwanese version (WHOQOL-BREF [TW]) [15]. The WHOQOL is a generic quality of life instrument that was designed to be applicable to people living under different circumstances, conditions and cultures [16-17]. It encompasses physical, psychological, social and environment domains comprehensively [16]. The WHOQOL-BREF is a generic, transcultural and short instrument that represents good psychometric characteristics in general and clinical settings [16]. The WHOQOL-BREF (TW) is reliable and valid from various validation studies [18-19].
On the other hand, little research has been carried out to further explore the potential relationship between the internet information technology and QoL. For the time being, both theoretical and empirical researches on the impact of the Internet are still in their infancy [7].
Furthermore, the advantage of the grey system theory is used to study uncertainty, and is superior in theoretical analysis of systems with uncertainty information and incomplete samples. Especially, it can be used in the large samples are not available or uncertain whether the data was representative. Besides, it can be used in the effective factor assessment. Therefore, this study adopted grey system theory to propose a feasible and effective analysis method, which is different from the previous method.
The purpose of this study was to discuss older adult users’ opinions on the use of internet information technology and its effect on their quality of life. The results are provided as reference for future studies, developers, and policy-makers.
2. Methodology
2.1. Data collection
This study surveyed the older adult users (>55 years old) of Taiwan as subjects. A total of 76 valid copies of a questionnaire were obtained with males accounting for 50% of the respondents. In terms of the educational level, 54% of the subjects had completed university and graduate schools. Most of them were the average monthly income ranged between NT$50,000 and NT$80,000 (amounting to 46%) (1 USD ≈ NT$32.78).
2.2. Measures of the constructs
The World Health Organization (WHO) defines QoL as an individual's perception of their position in life within the context of the culture and value systems in which they live, and in relation to their goals, expectations, standards and concerns [20]. This multidimensional instrument, the WHOQOL-100 [17], reflects the view that QoL is a broad-ranging concept that incorporates subjectively experienced QoL. It is a broad-ranging concept incorporating in a complex way the person's physical health, psychological state, level of independence, social relationships, personal beliefs and their relationship to salient features of the environment. The WHOQOL-100 was developed through an international collaboration of 15 culturally diverse countries. It has been expanded over the years to include more than 40 different language versions [21].
The WHOQOL Group simplified the standard questionnaire to a short form called the WHOQOLBREF [16]. The WHOQOL-BREF, an abbreviated 26-item version of the WHOQOL-100, has been demonstrated to be a valid and reliable brief assessment of QoL [18]. The Taiwan version of the WHOQOL-BREF [18] contains the 26 original items of the WHOQOL-BREF, plus two national items for Taiwan.
This research was based on domains covered by the Taiwanese version of WHOQOL-BREF. The factors used to measure perceived effects of the use of Internet on QoL are divided into 7 items: health promotion, safety, accessibility of medical care services, overall living quality, financial burden, social relationship, and acquisition of information. All evaluation items employ a five-point Likert-type scale for measurement, where 1, 2, 3, 4, and 5 indicate “strongly disagree,” “disagree,” “fair,” “agree,” and “strongly agree,” respectively.
2.3. Data analysis methods
This research adopted grey system theory to propose a feasible and effective analysis method, which is different from the previous method. The grey system theory is described as follows:
Traditional methods require a large number of samples. In contrast the grey system theory is designed to work with system where the available information is insufficient to characterize the system. Grey system theory is proposed by Deng [22]. Grey relational analysis (GRA) of grey system theory is an effective approach that is utilized for generalizing estimates under small sample and uncertain conditions. It can overpower the disadvantages of statistical method [23-24]. The main function of the grey relational analysis is to indicate the relational degree between two sequences by using the discrete measurement method to measure the distance [25].
Grey system theory is according to the degree of information. If the information is known entirely, the system is called a white system. If the information is being incomplete, it is called a grey system. If the information is unknown, it is called a black system.
The sources of imprecision include: unquantifiable information, non-obtainable information, incomplete information, and partial ignorance. The procedures of modeling grey relational analysis are introduced briefly as follows.
Step 1: Normalizing the original data.
The original data are commonly normalized by mean value:

Step 2. Calculate the grey relational coefficient.
The grey relational grade between the two series at a certain time point t is represented by
the grey relational coefficient γ(y0 (k), yi(k)), defined as

where i=1,2,…,n, k=1,2,…,m, ζ is the distinguishing coefficient between 0 and 1. Generally,
the distinguishing coefficient is set to=0.5 [22]. ζ is set as 0.5 in this study.
Step 3: Calculate the grey relational grade.
Grey relational grade for y0 and yi, i=1, 2,…, n, respectively are given by the average of the
grey
relational coefficients as described by the following equation:

Step 4: Ranking the grey relational grade.
The factor of grey relational yi is the similarity indicator of the pattern y0 and the pattern yi.
If
γ(y0, yi)>γ(y0, yj), then the pattern yi has characteristics closer to those of the reference
pattern
y0 than the pattern yj. It denotes as yi yj. [26]
3. Results and Discussion
3.1. Effect of use of the internet information technology on quality of life
Table 1 shows the effects of the perceived use of the internet information technology on quality of life. As seen, the acquisition of information (mean and standard deviations (S.D.) are 4.21 and 0.57, respectively) has the greatest effect on QoL, followed by the health promotion (mean and S.D. are 4.13 and 0.74, respectively), overall living quality (mean and S.D. are 3.93 and 0.62, respectively), social relationship (mean and S.D. are 3.86 and 0.99, respectively), and accessibility of medical care services (mean and S.D. are 3.86 and 0.72, respectively).
3.2. Grey relational analysis
3.2.1. Calculate the grey relational coefficients
The data of grey relational coefficients listed in Table 2.
3.2.2. Calculate the grey relational grade and rank
The grey relational grade of each quality of life can be obtained and shown in Table 3 and Figure 1.
The results showed the overall living quality and social relationship (grey relational grade = 0.766) have the greatest effects on the perceived effects of the internet information technology on their quality of life, followed by the safety (grey relational grade = 0.698), acquisition of information (grey relational grade = 0.695), and accessibility of medical care services (grey relational grade = 0.692), health promotion (grey relational grade = 0.676), and financial burden (grey relational grade = 0.656).
4. Conclusion
The purpose of this study was to discuss older adult users’ opinions on the use of internet information technology and its effect on their quality of life. This study adopted grey system theory to propose a feasible and effective analysis method, which is different from the previous method. The results are provided as reference for future studies.
The results showed the overall living quality and social relationship have the greatest effects on the perceived effects of internet information technology on their quality of life, followed by the safety, acquisition of information, and accessibility of medical care services.
Based on the older adult users’ opinions on the influence of internet information technology on quality of life, it is suggested that the overall living quality and social relationship could be enhanced; in other words, allowing older adult users to obtain more social relationship through the Internet could effectively enhance the quality of life.
Moreover, the result indicates that the grey system theory is a feasible and effective analysis method. This finding may serve as a reference to future studies.
5. References
| [1] | S.H. Billipp, “The psychosocial impact of interactive computer use within a vulnerable elderly population: A report on a randomized prospective trial in home health care setting,” Public Health Nursing, vol. 18, no. 2, pp. 138–145, 2001. |
| [2] | M. Karavidas, K.L, “Nicholas, L.K. Steve, “The effects of computers on older adult users,” Computers in Human Behavior, vol. 21, pp. 697–711, 2005. |
| [3] | H. White, E. McConnell, L.G. Branch, R. Sloane, C. Pieper, T.L. Box, “A randomized controlled trial of the psychosocial impact of providing Internet training and access to older adults,” Aging and Mental Health, vol. 6, no. 3, pp. 213–222, 2002. |
| [4] | M. Bier, M. Gallo, “Personal empowerment in the study of home Internet use by low-income families,” Journal of Research on Computing in Education, vol. 30, no. 2, pp. 107–121, 1997. |
| [5] | B. Anderson, K. Tracey, “Digital living: the impact (or otherwise) of the Internet on everyday life,” American Behavioral Scientist, vol. 45, no. 3, pp. 456–475, 2001. |
| [6] | C. Henderson, “How the Internet is changing our lives,” Futurist, vol. 35, no. 4, pp. 38–45, 2001. |
| [7] | L. Leung, P.S.N. Lee, “Multiple determinants of life quality: The roles of Internet activities, use of new media, social support, and leisure activities,” Telematics and Informatics, vol. 22, no. 3, pp. 161-180, 2005. |
| [8] | C. Cohen, “Guiding seniors,” Internet, vol. 64, no. 2, pp. 50–53, 2001. |
| [9] | S. Michie, C. Rosebert, J. Heaversedge, S. Madden and S. Parbhoo, “The effects of different kinds of information on women attending an out-patient breast clinic,” Psychol Health Med, vol. 1, pp. 285–296, 1996. |
| [10] | A. Jadad and A. Gagliardi, “Rating health information on the Internet: navigating to knowledge or to Babel?” J. Am. Med. Assoc, vol. 279, pp. 611–614, 1998. |
| [11] | G.M. Humphris, M. Duncalf, D. Holt and E.A. Field, “The experimental evaluation of an oral cancer information leaflet,” Oral Oncol, vol. 35, pp. 575–582, 1999. |
| [12] | B.J. Davison, P. Kirk, L.F. Degner and T.H. Hassard, “Information and patient participation in screening for prostate cancer,” Patient Educ Couns, vol. 37, pp. 255–263, 1999. |
| [13] | Y. Jang, H.C. Lin, Y. Wang, Y.H. Wu, “A validity study of the WHOQOL BREF assessment in persons with traumatic spinal cord injury,” Arch. Phys. Med. Rehabil, vol. 85, pp. 1890–1895, 2004. |
| [14] | C. Kuehner, C. Buerger, “Determinants of subjective quality of life in depressed patients: the role of self-esteem, response styles, and social support,” J. Affect. Disord, vol. 86, pp. 205–213, 2005. |
| [15] | S.C. Yang, P.W. Kuo, J.D. Wang, M.I. Lin, S. Su, “Quality of Life and Its Determinants of Hemodialysis Patients in Taiwan Measured With WHOQOL-BREF(TW),” American Journal of Kidney Diseases, vol. 46, no. 4, pp. 635-641, 2005. |
| [16] | The WHOQOL Group, “Development of the World Health Organization WHOQOL-bref. Quality of life assessment instrument,” Psychol. Med., vol. 28, pp. 551–558, 1998a. |
| [17] | The WHOQOL Group, “The World Health Organization Quality of Life Assessment (WHOQOL): development and general psychometric properties,” Soc Sci Med, vol. 46, pp. 1569–1585, 1998b. |
| [18] | G. Yao, C.W. Chung, C.F. Yu, J.D. Wang, “Development and verification of validity and reliability of the WHOQOL-BREF Taiwan version,” J. Formos. Med. Assoc, vol. 101, pp. 342–351, 2002. |
| [19] | G. Yao, J.D. Wang, C.W. Chung, “Cultural Adaptation of the WHOQOL Questionnaire for Taiwan,” Journal of the Formosan Medical Association, vol. 106, no. 7, pp. 592-597, 2007. |
| [20] | The WHOQOL Group, “The World Health Organization Quality of life assessment (WHOQOL): Position paper from the World Health Organization,” Soc. Sci. Med, vol. 41, pp. 1403, 1995. |
| [21] | he WHOQOL-Taiwan Group, “Development and Manual of the Taiwanese Version of WHOQOL [Chinese] (2nd Ed.),” The WHOQOL-Taiwan Group, Taipei, 2005. |
| [22] | J.L. Deng, “The introduction of grey system,” The Journal of Grey System, vol. 1, no. 1, pp. 1–24, 1982. |
| [23] | C.L. Chang, C.H. Tsai, L. Chen, “Applying grey relational analysis to the decathlon evaluation model,” International Journal of the Computer, the Internet and Management, vol. 11, no. 3, pp. 54–62, 2003. |
| [24] | N.H. Chiu, “An early software-quality classification based on improved grey relational classifier,” Expert Systems with Applications, vol. 36, pp. 10727–10734, 2009. |
| [25] | Y.M. Chiang and H.H. Hsieh, “The use of the Taguchi method with grey relational analysis to optimize the thin-film sputtering process with multiple quality characteristic in color filter manufacturing,” Computers & Industrial Engineering, vol. 56, pp. 648–661, 2009. |
| [26] | L.C. Hsu and C.H. Wang, “Forecasting integrated circuit output using multivariate grey model and grey relational analysis,” Expert Systems with Applications, vol. 36, pp. 1403–1409, 2009. |
Table 1
Effect of use of Internet on quality of life
|
Categories |
Mean |
Standard deviation
(S.D.) |
|||
|
Health promotion |
4.13 |
0.74 |
|
||
|
Safety |
3.59 |
0.85 |
|
||
|
Accessibility of
medical care services |
3.86 |
0.72 |
|
||
|
Overall living
quality |
3.93 |
0.62 |
|
||
|
Financial burden |
2.92 |
0.95 |
|
||
|
Social
relationship |
3.86 |
0.99 |
|
||
|
Acquisition of
information |
4.21 |
0.57 |
|
||
Table 2
The calculated grey relational coefficient
|
No. |
Health |
Safety |
Accessibility |
Overall |
Financial |
Social |
Acquisition |
|
1 |
0.459 |
0.717 |
0.978 |
0.629 |
0.338 |
0.385 |
0.804 |
|
2 |
0.544 |
0.608 |
0.496 |
0.510 |
0.463 |
0.992 |
0.558 |
|
3 |
0.592 |
0.397 |
0.978 |
0.629 |
0.637 |
0.385 |
0.580 |
|
4 |
0.865 |
0.900 |
0.985 |
0.946 |
0.965 |
0.985 |
0.839 |
|
5 |
0.865 |
0.900 |
0.985 |
0.946 |
0.578 |
0.985 |
0.839 |
|
6 |
0.459 |
0.717 |
0.646 |
0.629 |
0.338 |
0.646 |
0.804 |
|
7 |
0.765 |
0.900 |
0.985 |
0.946 |
0.614 |
0.985 |
0.839 |
|
8 |
0.865 |
0.900 |
0.649 |
0.946 |
0.965 |
0.985 |
0.839 |
|
9 |
0.835 |
0.717 |
0.482 |
0.475 |
0.637 |
0.978 |
0.804 |
|
10 |
0.865 |
0.900 |
0.985 |
0.946 |
0.614 |
0.985 |
0.839 |
|
11 |
0.865 |
0.900 |
0.985 |
0.946 |
0.614 |
0.985 |
0.839 |
|
12 |
0.459 |
0.511 |
0.646 |
0.930 |
0.442 |
0.482 |
0.580 |
|
13 |
0.719 |
0.954 |
0.494 |
0.682 |
0.736 |
1.000 |
0.542 |
|
14 |
0.422 |
0.459 |
0.668 |
0.682 |
0.371 |
0.392 |
0.542 |
|
15 |
0.835 |
0.717 |
0.482 |
0.629 |
0.637 |
0.978 |
0.580 |
|
16 |
0.835 |
0.717 |
0.482 |
0.629 |
0.637 |
0.978 |
0.580 |
|
17 |
0.531 |
0.459 |
0.494 |
0.682 |
0.500 |
1.000 |
0.430 |
|
18 |
0.741 |
0.926 |
0.652 |
0.691 |
0.529 |
0.496 |
0.762 |
|
19 |
0.765 |
0.900 |
0.649 |
0.700 |
0.614 |
0.985 |
0.839 |
|
20 |
0.741 |
0.926 |
0.992 |
0.691 |
0.529 |
0.496 |
0.762 |
|
21 |
0.765 |
0.392 |
0.985 |
0.946 |
0.578 |
0.985 |
0.839 |
|
22 |
0.865 |
0.900 |
0.985 |
0.946 |
0.578 |
0.985 |
0.839 |
|
23 |
0.719 |
0.459 |
0.494 |
0.682 |
0.500 |
0.494 |
0.430 |
|
24 |
0.765 |
0.900 |
0.649 |
0.946 |
0.614 |
0.985 |
0.839 |
|
25 |
0.422 |
0.459 |
0.392 |
0.682 |
0.371 |
0.668 |
0.542 |
|
26 |
0.531 |
0.459 |
0.392 |
0.682 |
0.500 |
0.668 |
0.542 |
|
27 |
0.865 |
0.900 |
0.675 |
0.636 |
0.965 |
0.649 |
0.793 |
|
28 |
0.544 |
0.926 |
0.671 |
0.510 |
0.681 |
0.496 |
0.558 |
|
29 |
0.741 |
0.926 |
0.652 |
0.962 |
0.350 |
0.992 |
0.762 |
|
30 |
0.835 |
0.717 |
0.646 |
0.930 |
0.637 |
0.978 |
0.804 |
|
31 |
0.531 |
0.459 |
0.392 |
0.505 |
0.500 |
0.494 |
0.542 |
|
32 |
0.544 |
0.926 |
0.992 |
0.691 |
0.681 |
0.652 |
0.558 |
|
33 |
0.592 |
0.717 |
0.646 |
0.475 |
0.442 |
0.978 |
0.580 |
|
34 |
0.865 |
0.702 |
0.985 |
0.946 |
0.965 |
0.985 |
0.839 |
|
35 |
0.422 |
0.365 |
0.392 |
0.505 |
0.500 |
1.000 |
0.542 |
|
36 |
0.531 |
0.620 |
0.494 |
0.682 |
0.500 |
0.494 |
0.542 |
|
37 |
0.608 |
0.392 |
0.649 |
0.946 |
0.965 |
0.985 |
0.839 |
|
38 |
0.865 |
0.900 |
0.675 |
0.946 |
0.965 |
0.649 |
0.793 |
|
39 |
0.865 |
0.392 |
0.985 |
0.700 |
0.614 |
0.675 |
0.839 |
|
40 |
0.422 |
0.365 |
0.392 |
0.682 |
0.371 |
0.494 |
0.542 |
|
41 |
0.765 |
0.702 |
0.649 |
0.946 |
0.965 |
0.675 |
0.793 |
|
42 |
0.741 |
0.608 |
0.671 |
0.691 |
0.463 |
0.671 |
0.762 |
|
43 |
0.459 |
0.511 |
0.646 |
0.629 |
0.637 |
0.385 |
0.580 |
|
44 |
0.544 |
0.687 |
0.671 |
0.962 |
0.835 |
0.671 |
0.762 |
|
45 |
0.898 |
0.608 |
0.671 |
0.691 |
0.681 |
0.652 |
0.558 |
|
46 |
0.459 |
0.717 |
0.482 |
0.629 |
0.637 |
0.978 |
0.580 |
|
47 |
0.592 |
0.876 |
0.646 |
0.629 |
0.912 |
0.978 |
0.580 |
|
48 |
0.608 |
0.702 |
0.649 |
0.946 |
0.965 |
0.985 |
0.598 |
|
49 |
0.608 |
0.503 |
0.649 |
0.946 |
0.965 |
0.649 |
0.598 |
|
50 |
0.741 |
0.926 |
0.671 |
0.691 |
0.350 |
0.671 |
0.762 |
|
51 |
0.835 |
0.717 |
0.646 |
0.629 |
0.637 |
0.978 |
0.453 |
|
52 |
0.608 |
0.900 |
0.985 |
0.946 |
0.614 |
0.985 |
0.839 |
|
53 |
0.592 |
0.511 |
0.646 |
0.930 |
0.338 |
0.978 |
0.804 |
|
54 |
0.459 |
0.717 |
0.646 |
0.930 |
0.338 |
0.978 |
0.804 |
|
55 |
0.544 |
0.608 |
0.671 |
0.691 |
0.681 |
0.496 |
0.762 |
|
56 |
0.544 |
0.608 |
0.671 |
0.691 |
0.681 |
0.652 |
0.762 |
|
57 |
0.865 |
0.503 |
0.985 |
0.946 |
0.965 |
0.985 |
0.793 |
|
58 |
0.459 |
0.717 |
0.646 |
0.475 |
0.912 |
0.482 |
0.580 |
|
59 |
0.608 |
0.900 |
0.649 |
0.946 |
0.965 |
0.985 |
0.839 |
|
60 |
0.741 |
0.608 |
0.671 |
0.962 |
0.463 |
0.671 |
0.762 |
|
61 |
0.835 |
0.717 |
0.978 |
0.930 |
0.637 |
0.385 |
0.580 |
|
62 |
0.592 |
0.717 |
0.482 |
0.629 |
0.912 |
0.482 |
0.804 |
|
63 |
0.765 |
0.702 |
0.985 |
0.946 |
0.965 |
0.675 |
0.793 |
|
64 |
0.765 |
0.900 |
0.985 |
0.946 |
0.965 |
0.985 |
0.598 |
|
65 |
0.422 |
0.459 |
0.494 |
0.505 |
0.500 |
0.392 |
0.542 |
|
66 |
0.592 |
0.511 |
0.646 |
0.930 |
0.637 |
0.646 |
0.580 |
|
67 |
0.865 |
0.900 |
0.985 |
0.946 |
0.965 |
0.675 |
0.598 |
|
68 |
0.592 |
0.717 |
0.646 |
0.629 |
0.442 |
0.978 |
0.804 |
|
69 |
0.741 |
0.608 |
0.496 |
0.691 |
0.681 |
0.992 |
0.762 |
|
70 |
0.592 |
0.511 |
0.646 |
0.475 |
0.338 |
0.482 |
0.580 |
|
71 |
0.835 |
0.717 |
0.482 |
0.930 |
0.637 |
0.646 |
0.804 |
|
72 |
0.865 |
0.900 |
0.675 |
0.636 |
0.965 |
0.985 |
0.598 |
|
73 |
0.544 |
0.608 |
0.671 |
0.691 |
0.835 |
0.671 |
0.558 |
|
74 |
0.865 |
0.900 |
0.649 |
0.946 |
0.965 |
0.985 |
0.839 |
|
75 |
0.865 |
0.900 |
0.649 |
0.946 |
0.965 |
0.649 |
0.793 |
|
76 |
0.608 |
0.597 |
0.649 |
0.700 |
0.413 |
0.675 |
0.839 |
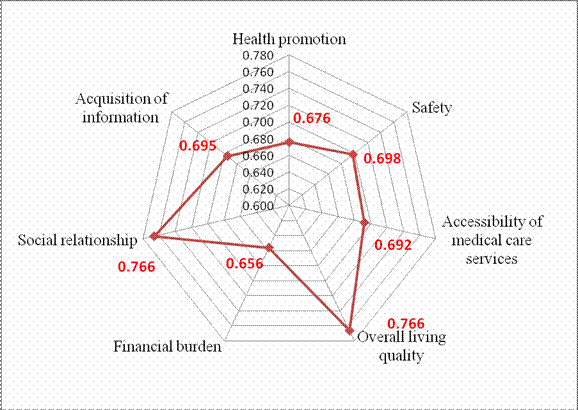
Fig. 1. Grey relational grade of each quality of life
Table 3
Results of grey relational grade and rank
|
Categories |
Grey relational grade |
Rank |
|
|
Health promotion |
0.676 |
6 |
|
|
Safety |
0.698 |
3 |
|
|
Accessibility of
medical care services |
0.692 |
5 |
|
|
Overall living
quality |
0.766 |
1 |
|
|
Financial burden |
0.656 |
7 |
|
|
Social
relationship |
0.766 |
1 |
|
|
Acquisition of
information |
0.695 |
4 |
|
About the Author
 Jui-Chen Huang is an assistant professor in the Department of Health Business
Administration, HUNGKUANG University, Taiwan. She received her PhD degree
in Technology Management from Chung-Hua University, Taiwan, as well as an MS
in Public Health from Kaohsiung Medical University, Taiwan. Her current research
interests include healthcare information management, technology management, Artificial Neural
Network, technology acceptance, innovation evaluation and long-term care management, and marketing.
She has three papers published in SCI and EI journals in recent year, and she is a reviewer of many SCI
journals.
Jui-Chen Huang is an assistant professor in the Department of Health Business
Administration, HUNGKUANG University, Taiwan. She received her PhD degree
in Technology Management from Chung-Hua University, Taiwan, as well as an MS
in Public Health from Kaohsiung Medical University, Taiwan. Her current research
interests include healthcare information management, technology management, Artificial Neural
Network, technology acceptance, innovation evaluation and long-term care management, and marketing.
She has three papers published in SCI and EI journals in recent year, and she is a reviewer of many SCI
journals.